Child Abuse vs. Political Leaning
UPDATE: See our latest study on the correlation between economic inequality and child abuse.

Child Abuse Statistics:
Create your custom report. KIDS COUNT data center: A project of the Annie E. Casey Foundation. (n.d.). Retrieved June 4, 2022, from https://datacenter.kidscount.org/
County Voting Records:
Steven ShepardSenior campaigns and elections editor12:52 a.m., a.m., A. T. P. R., a.m., N. K. N. P. C., a.m., N. K. N. P. C., a.m., N. K. N. P. C., a.m., C. M. S. politics editor12:42, a.m., A. T. P. R., Steven ShepardSenior campaigns and elections editor12:36 a.m., a.m., N. K. N. P. C., Steven ShepardSenior campaigns and elections editor12:15 a.m., a.m., N. K. N. P. C., Carla Alena MarinucciSenior Political Writer, P. O. L. I. T. I. C. O. C. A. P. a.m., a.m., A. T. P. R., a.m., A. T. P. R., a.m., C. C. N. P. R., a.m., C. C. N. P. R., a.m., A. T. P. R., p.m., M. C. B. C. R., p.m., C. C. N. P. R., … p.m., L. B.-L. N. political reporter5:36. (n.d.). Live election results: The 2020 presidential race. POLITICO. Retrieved June 4, 2022, from https://www.politico.com/2020-election/results/president/
County Populations:
Original data from United States Census Bureau. B01001 SEX BY AGE, 2020 American Community Survey 5-Year Estimates. U.S. Census Bureau, American Community Survey Office. Web. 17 March 2022. http://www.census.gov/.
Data aggregated and made available by Cubit.
Summary
There exist a long-standing Q-Anon conspiracy theory on the right that involves pedophile rings and liberals somehow grooming and taking advantage of children. Clearly, this is a false narrative, but the existence of the narrative implied that perhaps there is some factual basis. In order for that to be true, that liberals (and somehow only liberals) are involved in systematic child abuse, then there must be some sign in the actual data that one political party, or adherents to beliefs of one party (specifically, Democrats), are more likely to perpetrate child abuse than the other major party (Republicans). If that is true, then at the very least we must see some sort of correlation between the two.
In exploring this possibility, we needed to compare political leaning to incidents of child abuse. We took the vote in the last (2020) election to be an indication of political leaning for a particular county. This information is publicly accessible on Politico’s website. Specifically, we were interested in the proportion of the population who voted for Trump, Biden or didn’t vote. We used the Ann E. Casey Foundation’s aggregated statistics on child abuse for each county, as a proportion of the overall population. We then ran a correlation analysis on these two data points and discovered that there is a correlation between political ideology and child abuse trends. Counties with the most Trump voters were weakly correlated (0.1355) with reported or verified incidents of child abuse, while incidents among the control group (abstained from voting) were also weakly correlated with incidents of child abuse (0.1230). However, incidents of child abuse were negatively correlated with higher proportions of Biden voters (-0.2511).
In other words, if a county had a higher proportion of Trump voters than Biden voters, there were generally higher reports of child abuse.
There are a few different ways to look at the correlations. It may be that Trump voters are more diligent at reporting incidents of child abuse. Or, it may be that Biden voters are less likely to commit child abuse or to have enacted policies that reduce the overall number of child abuse incidents. To examine the first hypothesis, we will next look at reported versus substantiated child abuse claims by voting preference by county. All we know now is that reports of child abuse are more common in Republican-leaning counties versus Democratic-leaning areas. Here’s another way to look at the same data:
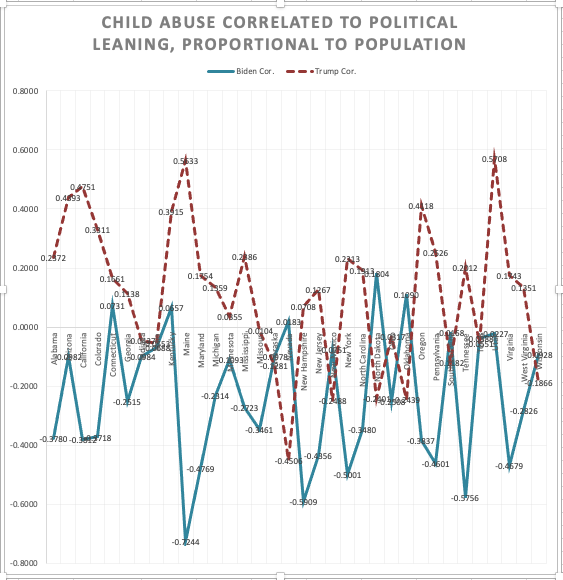
Same data in one simple graph.
What’s more clear in this graph is just how different these indicators are. You can clearly see that the blue, connected line only surpasses the 0.00 (no correlation) from negative territory a handful of times. The inverse is true for those trump-heavy counties in the same states.
These data are a starting point. Since the correlations are across the same counties, one thing we will be looking at is what the policies are like in the Trump-heavy counties as opposed to the Biden-heavy counties. We want to see if specific policy choices deviate, or if child abuse reporting thresholds are the same in both types of environments.
There are some weaknesses in this analysis. It’s important to note that child abuse counts were from prior years because some constituencies are no longer counting child abuse, or are no longer reporting those counts to the KidsCount. As such, the voting metrics from 2020 may not be what they were at the time of the child abuse reports. We will be digging further into this. Also, in many states, the correlation analysis was very close to zero and therefore we will be looking at those with lower correlations to determine if we can determine correlation by some other means.
Don’t take our word for it. We’ve provided a download button (below) to the data we used for the correlation analysis so that you can analyze the data for yourself. At the top, you’ll see the links to where we went to get the data. If you find a problem with our method, data, or calculations, please feel free to comment here or send an email to: chuck@rightandfreedom.com for follow up and we will fix the mistake if verified.